


Table of Contents
Data is the most important component of any research. It needs to be presented effectively in a paper to ensure that readers understand the key message in the paper. Figures and tables act as concise tools for clear presentation. Tables display information arranged in rows and columns in a grid-like format, while figures convey information visually, and take the form of a graph, diagram, chart, or image. Be it to compare the rise and fall of GDPs among countries over the years or to understand how COVID-19 has impacted incomes all over the world, tables and figures are imperative to convey vital findings accurately.
So, what are some of the best practices to follow when creating meaningful and attractive tables and figures? Here are some tips on how best to present tables and figures in a research paper.
Guidelines for including tables and figures meaningfully in a paper:
- Self-explanatory display items: Sometimes, readers, reviewers and journal editors directly go to the tables and figures before reading the entire text. So, the tables need to be well organized and self-explanatory.
- Avoidance of repetition: Tables and figures add clarity to the research. They complement the research text and draw attention to key points. They can be used to highlight the main points of the paper, but values should not be repeated as it defeats the very purpose of these elements.
- Consistency: There should be consistency in the values and figures in the tables and figures and the main text of the research paper.
- Informative titles: Titles should be concise and describe the purpose and content of the table. It should draw the reader’s attention towards the key findings of the research. Column heads, axis labels, figure labels, etc., should also be appropriately labelled.
- Adherence to journal guidelines: It is important to follow the instructions given in the target journal regarding the preparation and presentation of figures and tables, style of numbering, titles, image resolution, file formats, etc.
Now that we know how to go about including tables and figures in the manuscript, let’s take a look at what makes tables and figures stand out and create impact.
How to present data in a table?
For effective and concise presentation of data in a table, make sure to:
- Combine repetitive tables: If the tables have similar content, they should be organized into one.
- Divide the data: If there are large amounts of information, the data should be divided into categories for more clarity and better presentation. It is necessary to clearly demarcate the categories into well-structured columns and sub-columns.
- Keep only relevant data: The tables should not look cluttered. Ensure enough spacing.
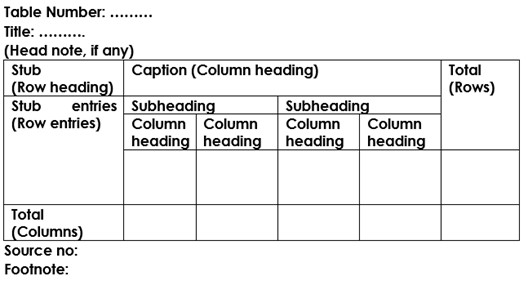
Example of table presentation in a research paper
For comprehensible and engaging presentation of figures:
- Ensure clarity: All the parts of the figure should be clear. Ensure the use of a standard font, legible labels, and sharp images.
- Use appropriate legends: They make figures effective and draw attention towards the key message.
- Make it precise: There should be correct use of scale bars in images and maps, appropriate units wherever required, and adequate labels and legends.
It is important to get tables and figures correct and precise for your research paper to convey your findings accurately and clearly. If you are confused about how to suitably present your data through tables and figures, do not worry. Elsevier Author Services are well-equipped to guide you through every step to ensure that your manuscript is of top-notch quality.